Challenge
The goal is to predict one app's gross profit in the future based on its historical data in last 30 days.
The main painpoint is:
We need to find a way for user to easily and quickly input those data within quite a long time range.
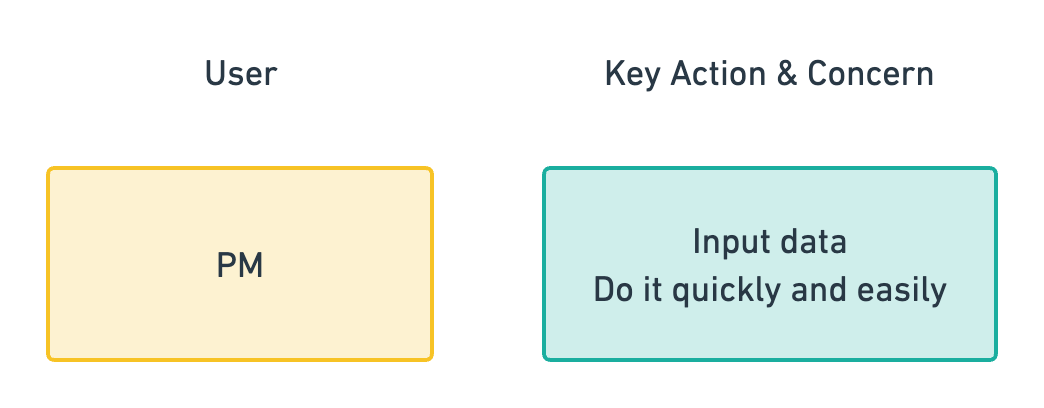
A brief view of users and key information
Version 1
The flow is shown below. This is a one-way process.

A One-way Process
The wireflow of version 1 is also shown below.
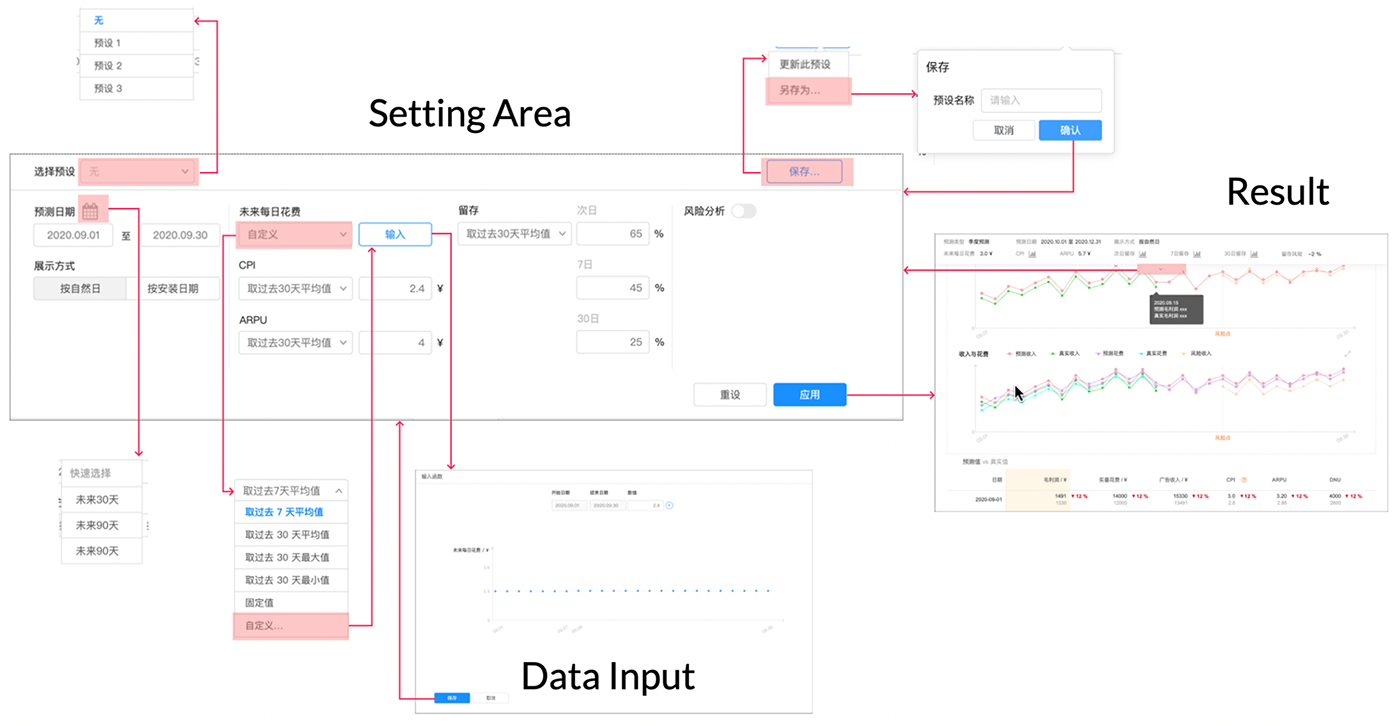
Wireflow Version 1
For the interaction, I have to say there are 3 problems:
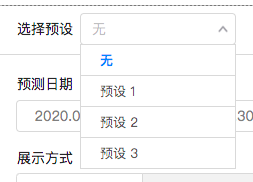
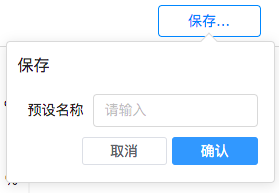
- To create a new preset, the action is not very clear to the user. You have to select "None" first and save it as a new preset after finishing setting.
- In the dialog, the way to input data is still like working in Excel.
User must know clearly what should input before coming into this data input dialog.
The curve as a visual display result is shown after you enter the data.
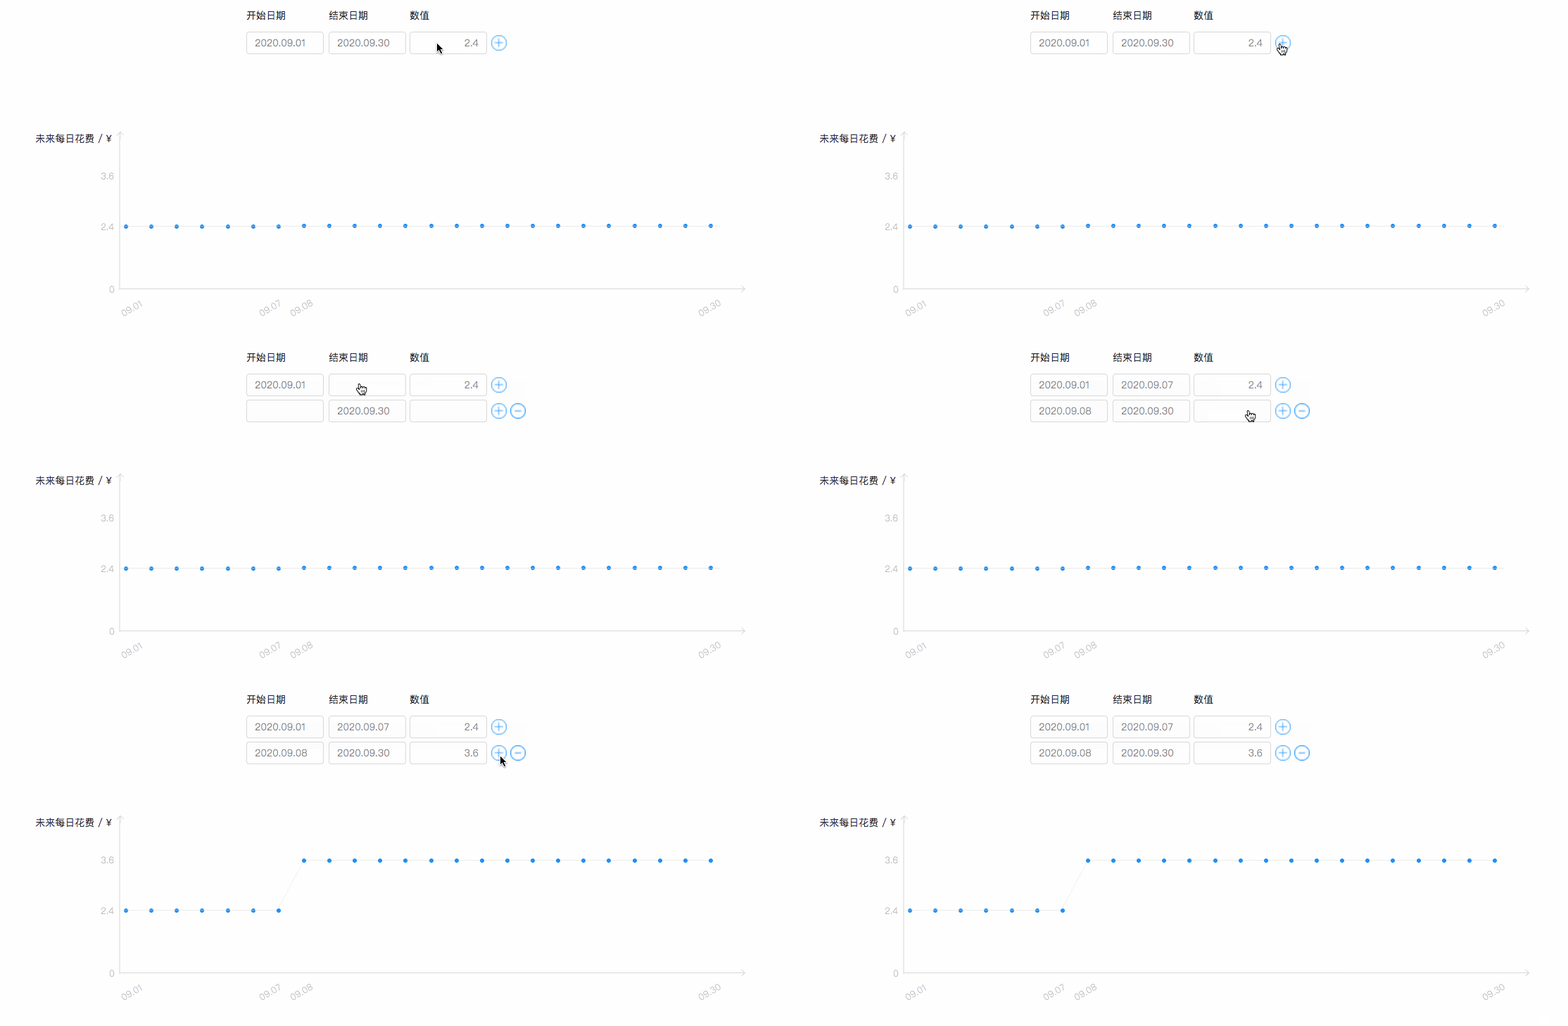
- The whole input process is not intuitive enough. After you apply the preset to see the results below, you probably forget to update it.
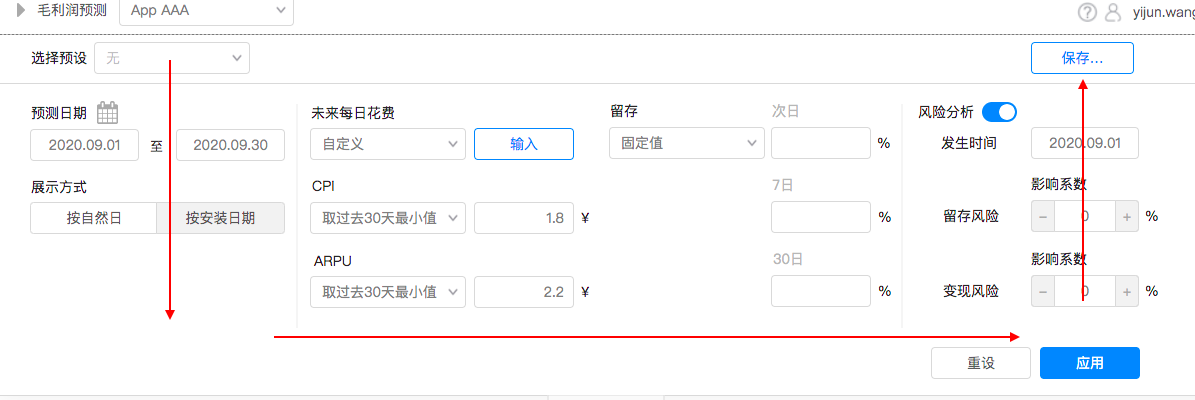
Going back may get the user confused
Version 2 (Optimized)
We import Machine Learning into this process. Now the data is calculated based on the initial parameters, and the user can adjust data manually and return, letting the algorithm optimize the result, which creates a loop.

Optimized Process Involving Machine Learning
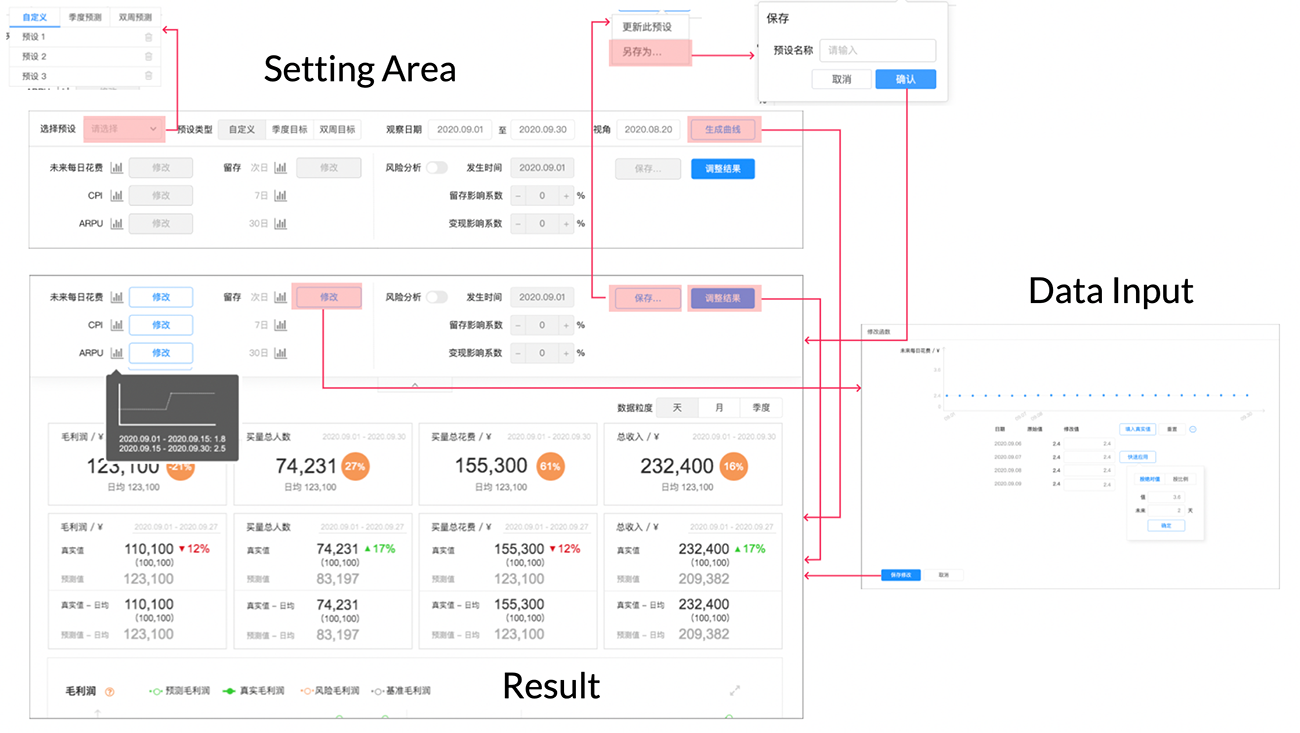
Wireflow Version 2
For 3 problems mentioned above, now the interaction is better:
- Now the seasonal / bi-week plan (different preset types) are listed for the user to complete, which means you can only use them in the real OKR. If you don't choose any of these two types, then the save button will have update / save as another customized preset.
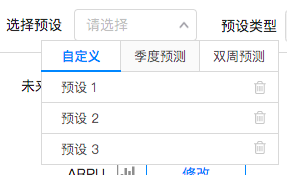
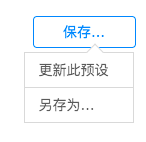
Save As appears when you don't select the seasonal / bi-week plan
- To input / update data, we iterate for several times.
First we image drawing the curve and generate the relevant data. It cannot proceed due to technical constraints.
Then we try changing the curve after a certain point, which is only easy for first use, then any modification would be painful.
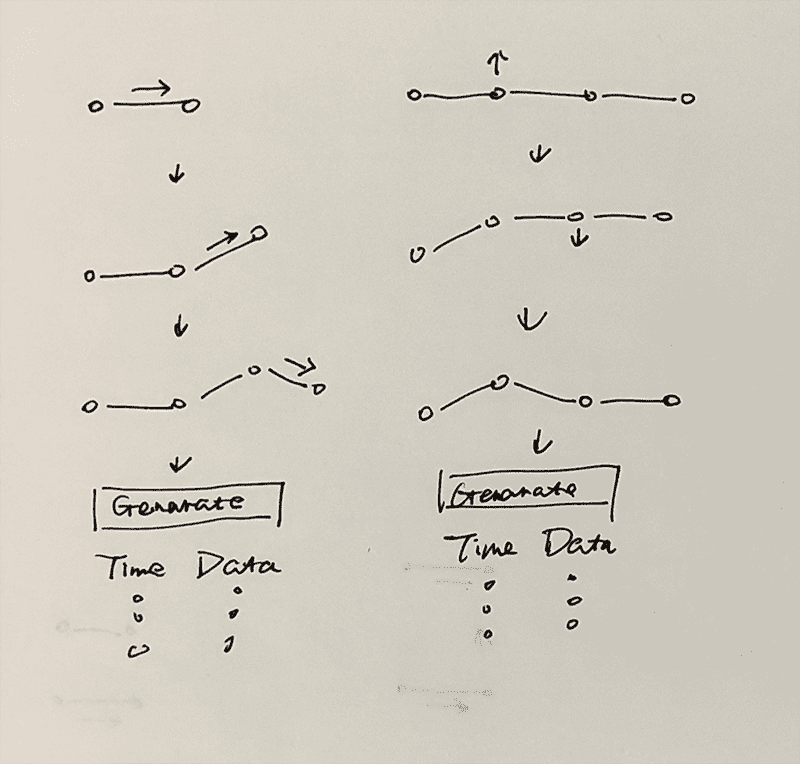
Sketches on different ways to input data
Now the final solution is shown below, where the data is split into two columns: the original calculated one and the new one. You can choose to quickly apply a value absolutely / relatively within a certain range, or fill in real data.
The curve is now a time sequence of data and let you get a general idea first then adjust accordingly.
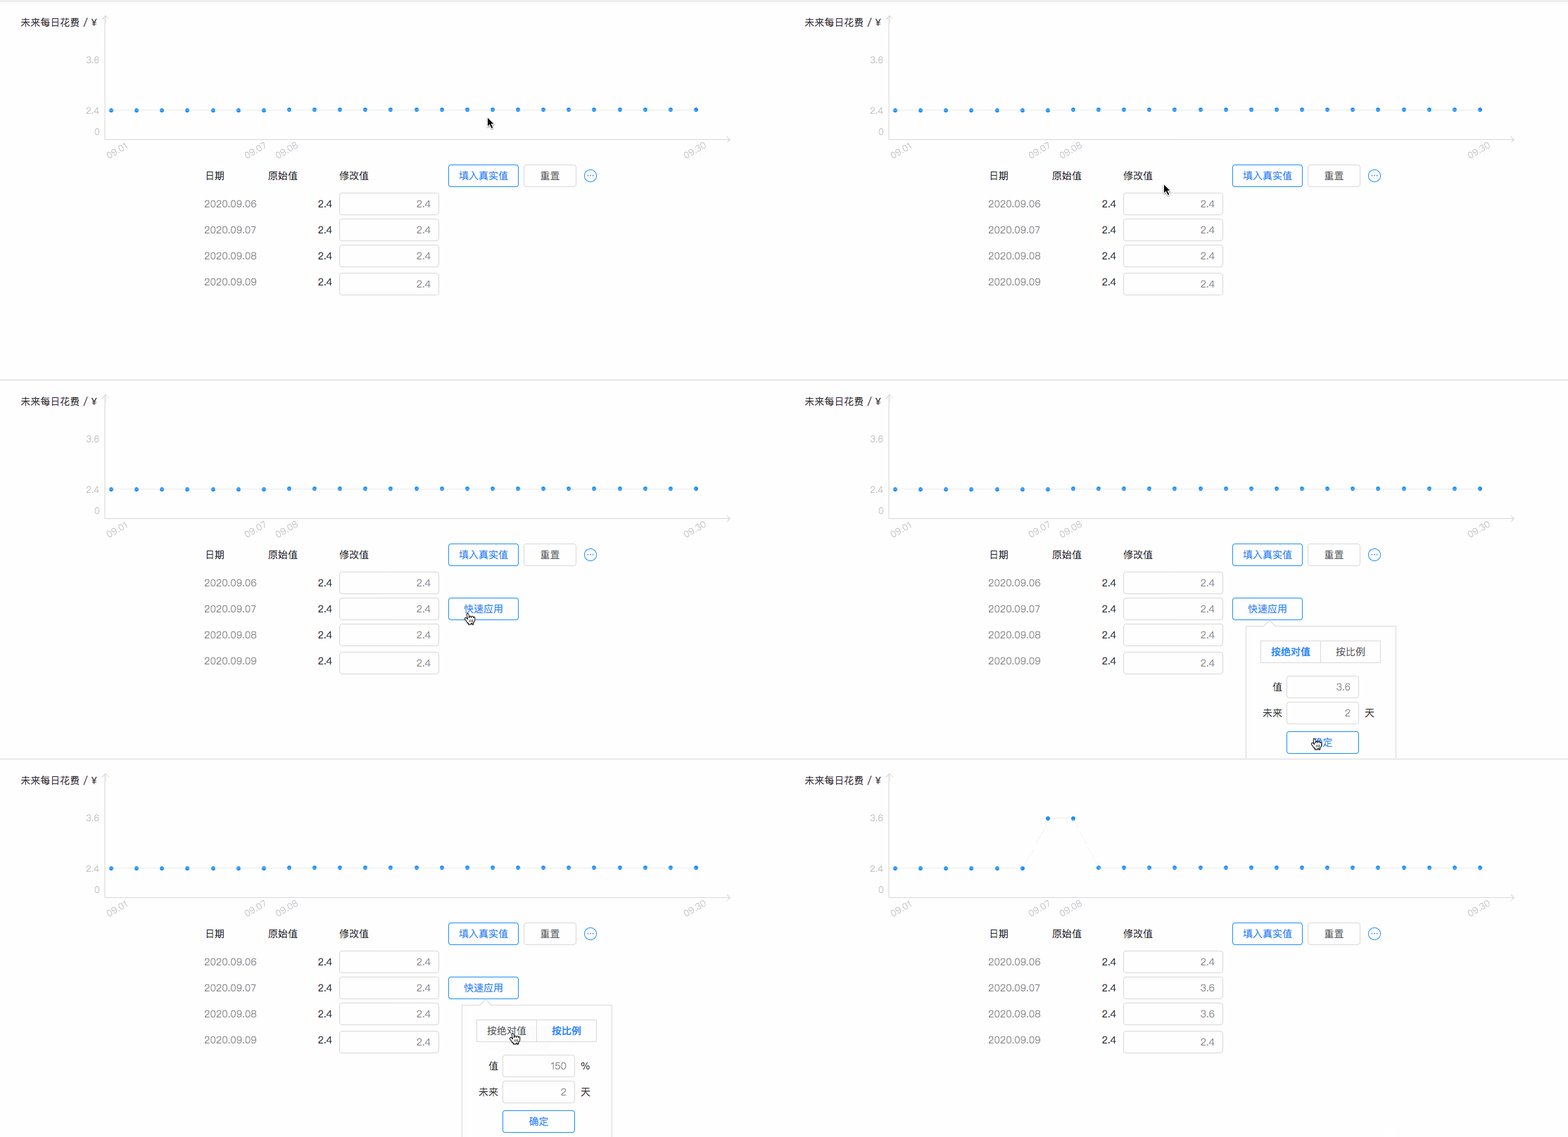
- The whole input process now is smoother. Selecting the preset is part 1 and part 2 is for modification and saving.

A Clearer Path
The Optimized Process is shown below, when the result is adjusted, the setting area will collapse to let the user to focus on the graph and the table.
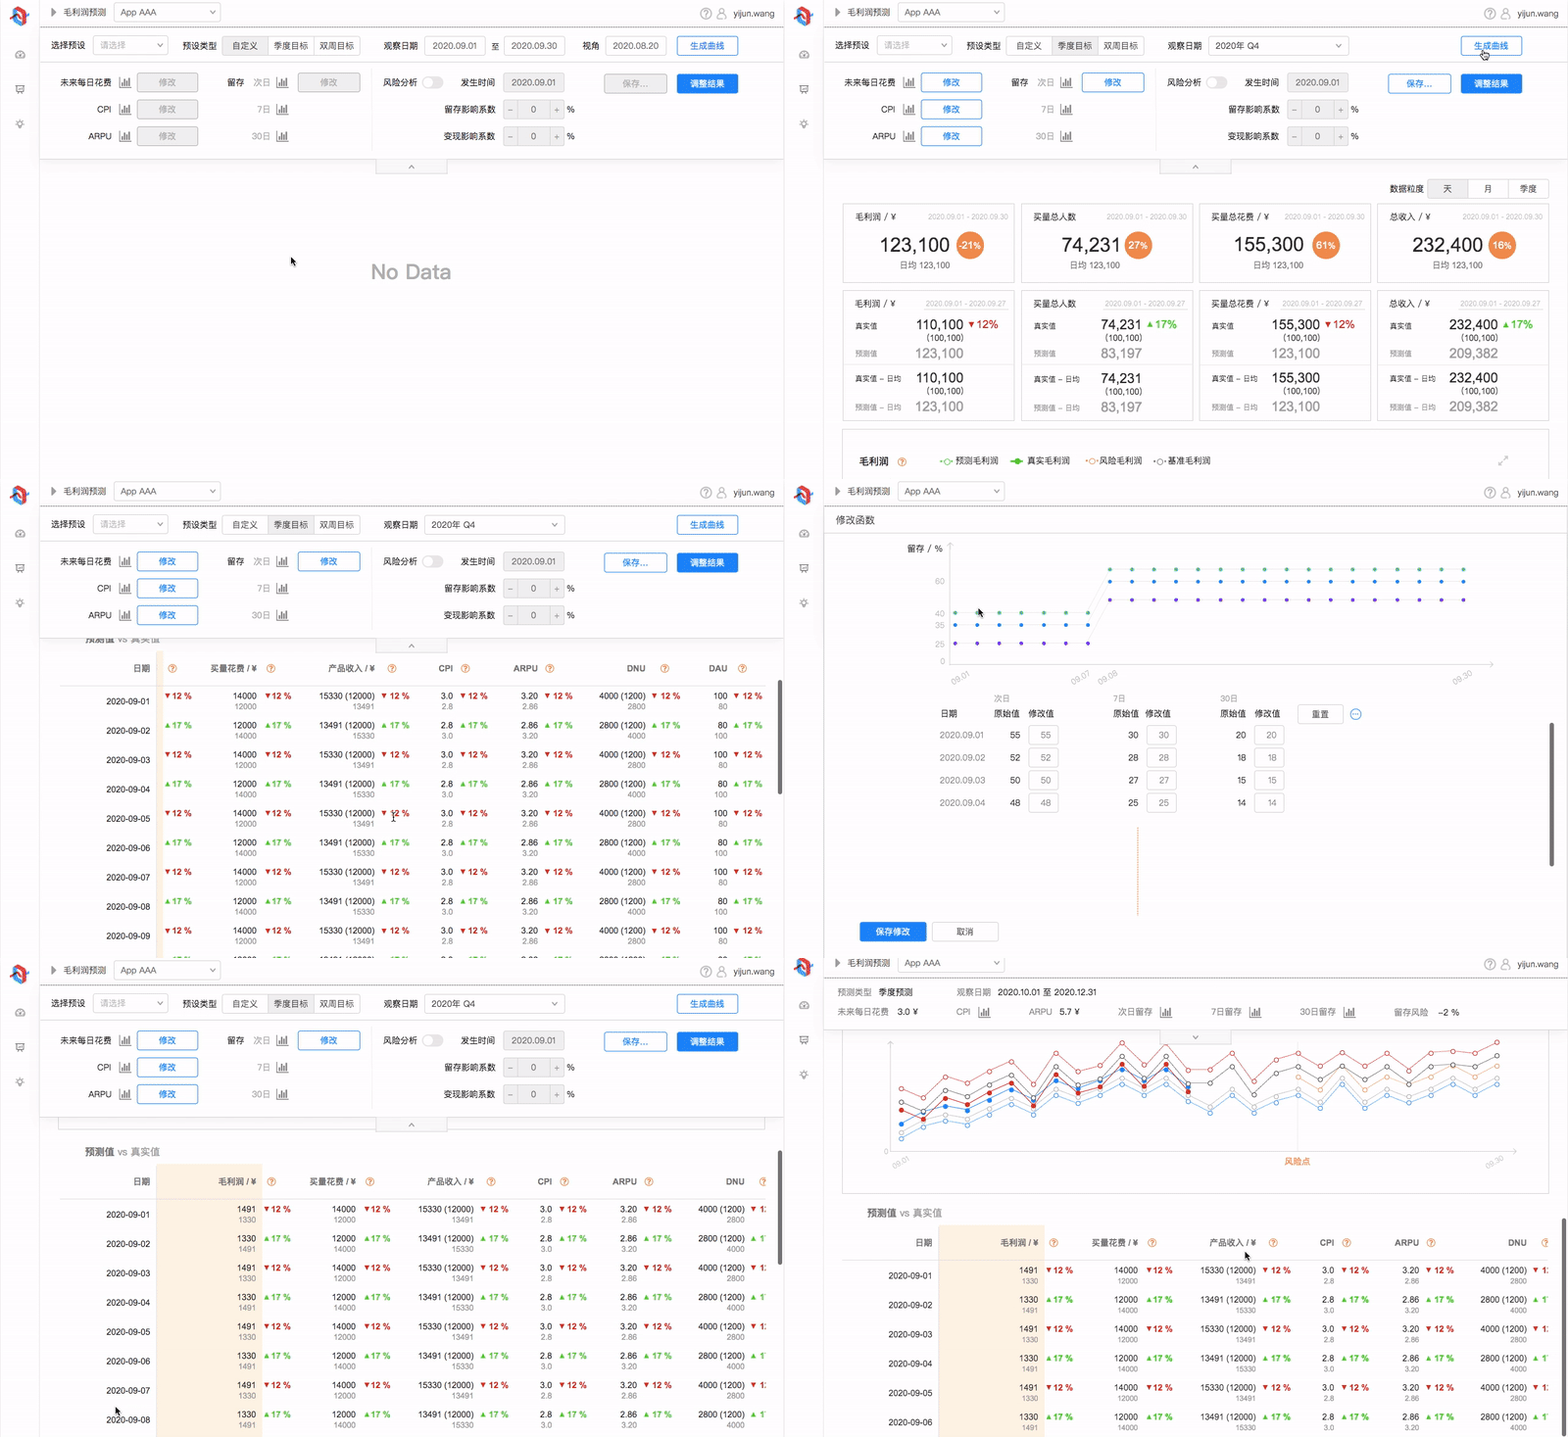
General Operation Process
Key Metrics
- Task Time ↘
- Error Rate ↘
- User Satisfaction ↗↗
Learning
Machine Learning can not only accelerate calculation
but also improve user experience.